
Australia’s rooftop solar fleet reached 27.57 GW in 2025, with 1.87 GW of new capacity added from January to October. More than 4.24 million households now have panels on their roof, making rooftop PV one of Australia’s biggest and most consistent energy generators.
Rooftop PV remains the largest source of distributed energy in the country and continues to play a central role in Australia’s daytime electricity supply.


Australia’s 2025 rooftop solar snapshot
Rooftop solar installations fell 21% year-on-year in 2025, the first drop after ten consecutive years of growth.
Despite the slowdown, total national capacity continued to rise, and average system sizes remained at record levels, reflecting how Australians are still buying solar for long-term savings and self-consumption.
Key stats
- 27.57 GW total national rooftop PV capacity
- 1.87 GW installed from January–October 2025
- Installations are down 21% year-on-year (compared to 2.38 GW over the same period in 2024)
- 4.24 million total rooftop solar installations
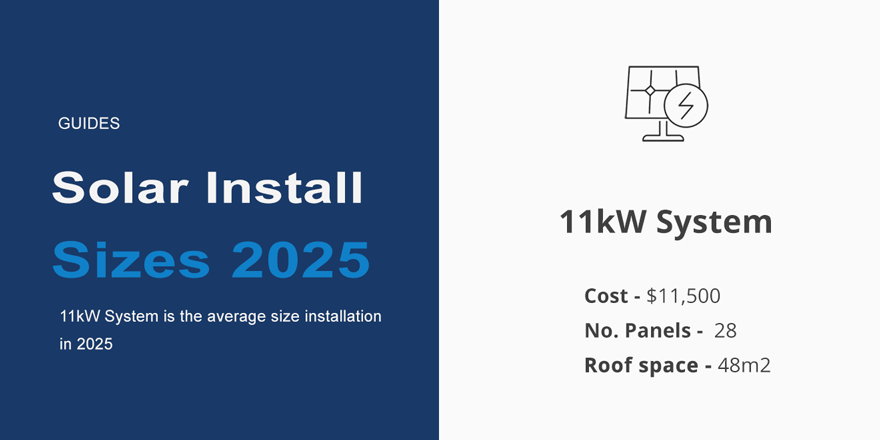
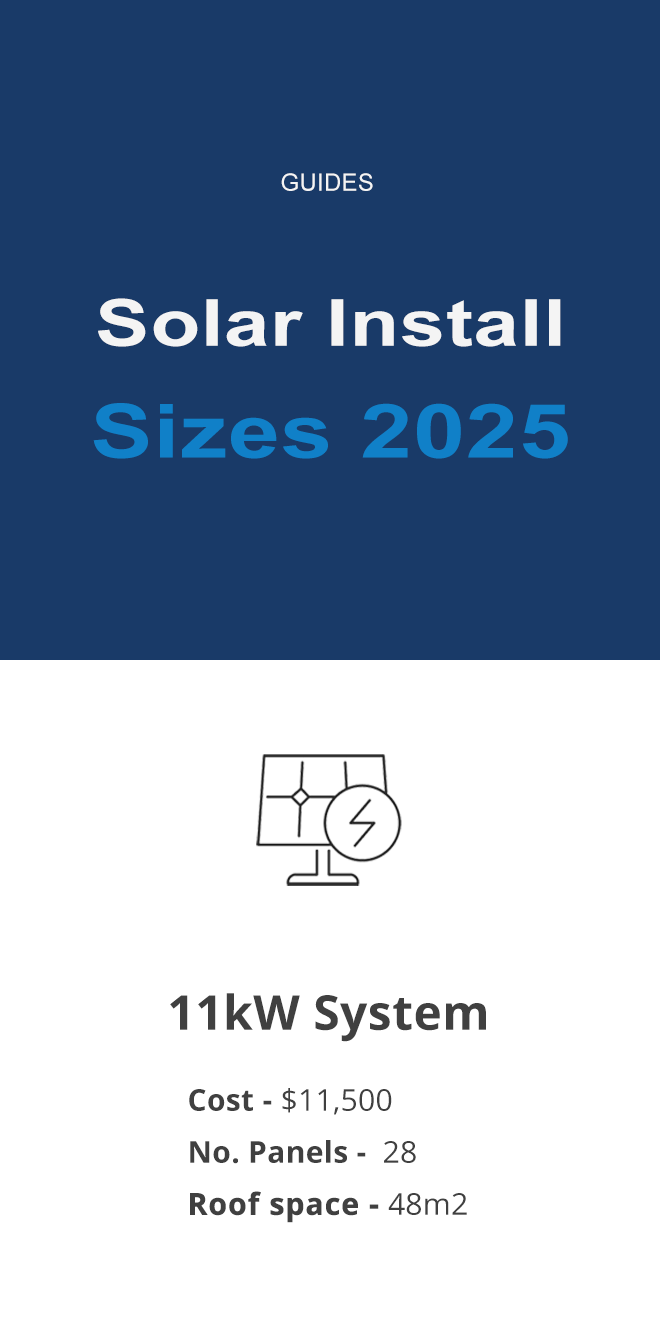
- Average system size is 11 kW in 2025
- Rooftop PV supplies > 12% of Australia’s electricity
| Metric | Jan - Oct 2025 |
|---|---|
| New Installations | 198,117 |
| PV capacity added | 1.87 GW |
| Cumulative capacity | 27.57 GW |
| Average system size | 11 kW |
| Battery attachment | 32% |
| Households with solar | 4.24+ million |
This page breaks down the latest national, state, and system-level statistics — using Clean Energy Regulator STC installation data up to October 2025
National Rooftop Solar Trends
Rooftop solar installation trends in Australia 2015 to 2025
Australia’s rooftop solar fleet has expanded sharply over the past decade, with capacity rising from 5 GW in 2015 to 27.57 GW in 2025. The table below shows how annual installs, capacity growth and system sizes have changed year by year.
| Year | Systems Installed | Cumulative Capacity |
|---|---|---|
| 2015 | 141,500 | 5.1 GW |
| 2016 | 132,697 | 5.8 GW |
| 2017 | 174,942 | 7.0 GW |
| 2018 | 224,852 | 8.6 GW |
| 2019 | 284,031 | 10.8 GW |
| 2020 | 370,320 | 13.4 GW |
| 2021 | 377,458 | 16.3 GW |
| 2022 | 315,717 | 19.0 GW |
| 2023 | 333,865 | 21.8 GW |
| 2024 | 318,865 | 25.5 GW |
| 2025 | 198,117 | 27.57 GW |
| Total | 4,240,286 | 27.57GW |
Solar installation by state in 2025
Every Australian state recorded lower installation volumes in 2025 compared with the same period in 2024.
The following tables compare new capacity added, total systems in each state, and rooftop penetration as a percentage of households.
| State/Territory | Total Installed Capacity (GW) | % of Homes With Solar |
|---|---|---|
| NSW | 7.1 GW | 29% |
| QLD | 6.5 GW | 38% |
| VIC | 5.0 GW | 28% |
| SA | 1.9 GW | 43% |
| WA | 3.2 GW | 36% |
| TAS | 0.46 GW | 27% |
| ACT | 0.26 GW | 24% |
| NT | 0.05 GW | 12% |
| Australia-wide | 27.57 GW | 34% |
Average solar system sizes and installation trends
The average rooftop solar system installed in 2024 was 10.3 kW, rising to 11.08 kW in 2025. Consumers continue to opt for oversize systems for self-consumption and long-term EV and electrification needs.
System size trends show clear consumer behaviour patterns:
- Households are installing larger systems to maximise self-consumption
- Declining feed-in tariffs encourage oversizing for daytime usage
- EV charging and battery storage drive further system upsizing
For the fifth consecutive year, Australia installed more than 300,000 systems, despite a slight dip compared to 2023.
Australian Home Battery Installations Statistics
Battery uptake has accelerated sharply over the past five years, supported by falling system prices and state-based rebates. From 1 July 2025, solar batteries were also added to the national STC scheme, further boosting demand. The Cheaper Home Battery Scheme boasts a 30% discount for eligible homeowners.
| Year | Annual Battery Installs | Annual Battery Installs |
|---|---|---|
| 2020 | 9,357 | 9,357 |
| 2021 | 24,038 | 33,395 |
| 2022 | 31,694 | 64,089 |
| 2023 | 46,127 | 111,216 |
| 2024 | 74,582 | 185,789 |
| 2025 | 90,546 | 276,335 |
👉 Pro tip: See our Battery Basics 101 Guide to better understand how a solar battery works and what it can do for your home.
Solar battery installations by state
Battery uptake isn’t uniform across the country. NSW, Victoria and Queensland continue to lead the market, while smaller states show modest but consistent growth. The table below highlights the most recent state-level figures.
| State | Installs |
|---|---|
| NSW | 31,705 |
| VIC | 15,456 |
| QLD | 17,367 |
| SA | 12,296 |
| WA | 10,575 |
| ACT | 1,790 |
| TAS | 1,089 |
| NT | 268 |
Rooftop solar’s role in Australia’s electricity supply and exports
Rooftop solar contributed 12.4% of Australia’s total electricity generation in 2024 — one of the strongest figures globally.
Export behaviour shows:
- 27% of customers export solar back to the grid
- Exports represent 10% of all electricity delivered by distribution networks
- 99% of export energy comes from rooftop solar
- ACT saw the largest growth in export participation since 2020 (up 8%)
- South Australia leads with exports representing 21% of all energy delivered locally
South Australia also achieved the steepest rise in export share since 2020–21, increasing by 13 percentage points.
How EV uptake is reflected in system size and battery statistics
Households adopting EVs are increasingly installing larger solar systems and pairing them with batteries.
While EV-specific CER datasets are limited, the shift is visible in system-size growth (above 10 kW) and rising battery attachment rates.
- Daytime EV charging increases self-consumption, favouring larger arrays
- Battery adoption supports overnight EV charging and grid-friendly behaviour
FAQ
How many Australian homes have rooftop solar?
More than 4.1 million homes have rooftop solar as of Oct 2025. This represents 38.4% of all homes in Australia.